S&P500 Daily Action Areas & Price Targets 23/7/26

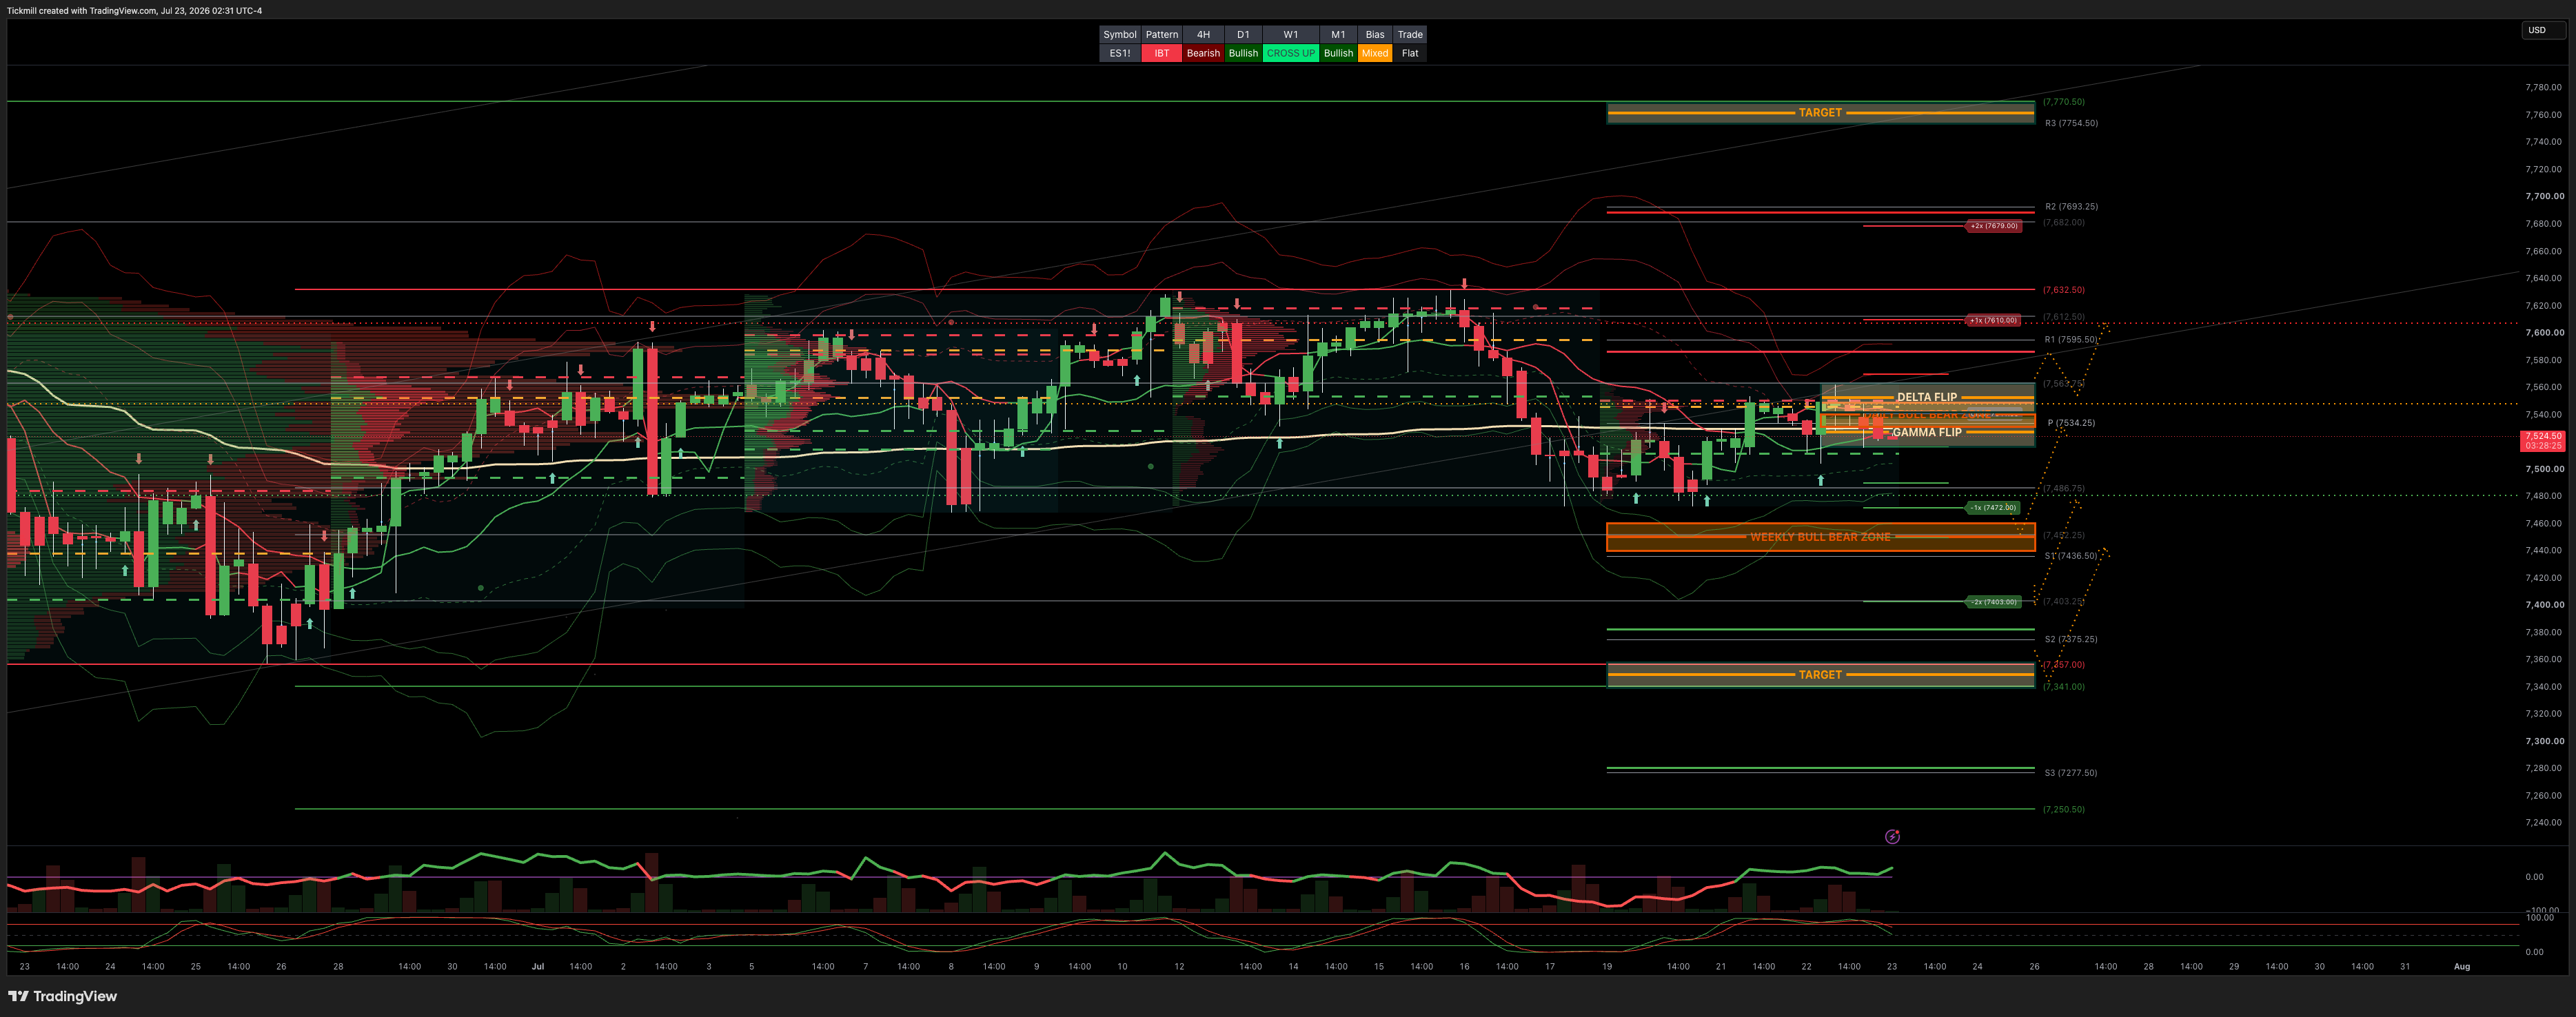
S&P500 Daily Action Areas & Price Targets 23/7/26
***QUOTING ES1! FOR CASH US500 EQUIVALENT LEVELS, SUBTRACT POINT DIFFERENCE***
WEEKLY BULL BEAR ZONE 7460/40
WEEKLY RANGE RES 7632 SUP 7358
MONTHLY RANGE RES 7838 SUP 7258
JHEQX Q3 Collar Short Call Cap: ~7,750 – 7,900 - Long Put Strike: ~7,050 – 7,100 (approx. 5% downside protection) Short Put Strike: ~5,950
DEC2025 OPEX to DEC2026 OPEX is 945 points giving us a range of [5889,7779]
SPX PUT/CALL RATIO 1.13 (The numbers reflect options traded during the current session.) A put-call ratio below 0.7 is generally considered bullish, and a put-call ratio above 1.0 is generally considered bearish.
GS Flow Desk: large S&P 31Aug 7000/7950 strangle in roughly $20mm vega / $115mm premium …My Read – classic “big convexity versus carry” trade: either someone paid a lot to own a wide August move, or someone got paid a lot to bet that the S&P stays comfortably inside the 7000–7950 corridor
DAILY VWAP BULLISH 7525
WEEKLY VWAP BEARISH 7563
MONTHLY VWAP BULLISH 7036
DAILY STRUCTURE - BALANCE 7627/7469
WEEKLY STRUCTURE - BALANCE 7648/7247
MONTHLY STRUCTURE - OTFH - 7247
Balance: This refers to a market condition where prices move within a defined range, reflecting uncertainty as participants await further market-generated information. Our approach to balance includes favouring fade trades at the range extremes (highs/lows) while preparing for potential breakout scenarios if the balance shifts.
One-Time Framing Higher (OTFH): This represents a market trend where each successive bar forms a higher low, signalling a strong and consistent upward movement.
One-Time Framing Lower (OTFL): This describes a market trend where each successive bar forms a lower high, indicating a pronounced and steady downward movement.
DAILY BULL BEAR ZONE 7540/7550
GAMMA FLIP 7529
DELTA FLIP 7495
DAILY RANGE RES 7610 SUP 7474
2 SIGMA RES 7679 SUP 7406
VIX BULL BEAR ZONE 17.7
TRADES & TARGETS
LONG ON ACCEPTANCE ABOVE DELTA FLIP ZONE TARGET DAILY RANGE RES
LONG ON REJECT/RECLAIM WEEKLY BULL/BEAR ZONE TARGET RTH CLOSE>DAILY BULL/BEAR ZONE
***ADDITIONAL SETUPS & TARGETS HIGHLIGHTED ON THE CHARTS***
(I FADE TESTS OF 2 SIGMA LEVELS ESPECIALLY INTO THE FINAL HOUR OF THE NY CASH SESSION AS 90% OF THE TIME WHEN TESTED THE MARKET WILL CLOSE ABOVE OR BELOW THESE LEVELS)
NOMURA VOL TRADING DESK VIEWS
Nomura Vol Takeaways — Crude Is the Macro Vol Switch; Equities Can Rally First, Then Get Squirrely
The big picture is that macro vol has been asleep, equity dispersion has been doing all the work, and now crude is threatening to turn the macro-vol switch back on.
For months after the first Iran/crude “hawkish knock-on” scare, rates and FX vol compressed aggressively as repeated ceasefire headlines helped oil bleed lower. Even after the back-to-back dovish US inflation prints, vols actually firmed modestly because the surface had already compressed so far. The “Great Hawkish CB / Inflation Scare of 2026” lasted only about six weeks, but it created a meaningful steepener unwind / flattening and rebuilt short-STIR positioning. CTA trend is now back to 100% short across all STIR contract models.
Recently, customer flows had started leaning the other way: more bullish / steepening UST expressions, and upside SOFR option structures such as call flies and ratios. In other words, investors were trying to fade the prior hawkish repricing back toward a neutral range-trading setup — not a recession trade, but a “macro malaise / range trade” trade.
That entire benign setup is now at risk because Brent is making highs since early June as the Iran conflict re-escalates.
1. Crude Is Again “The Straw That Stirs the Drink”
The renewed escalation matters because crude can re-open the same hawkish feedback loop the market had just finished unwinding. Reports of widened US airstrikes, Iranian missiles fired toward US bases, elevated Red Sea threat levels, darkening diplomatic channels, and comments that power plants are now fair game all raise the risk that oil becomes the macro catalyst again.
The mechanism is straightforward:
Crude spikes
Inflation tails reprice higher
Central bank easing / dovish expectations get challenged
Rates vol rises
Cross-asset vol rises
Risk assets reprice because “all assets are short rate vol”
That last phrase is the key. In this framework, every asset class / all market beta is short interest-rate volatility. Equities, credit, FX carry, vol-control, risk-parity, and systematic beta all implicitly rely on rate vol staying contained. When crude threatens an inflation shock, rates vol becomes the transmission mechanism into everything else.
For energy importers, this is a direct negative: higher crude pressures inflation, terms of trade, consumers, and central banks. For the US, the impact is more mixed because the US still has energy-production offsets, but even there the inflation/rate-vol channel can dominate risk appetite.
2. Rates / FX Vol Had Become Too Compressed
Before this crude re-acceleration, macro was stuck in a low-conviction range. Rates and FX vol had been in “shambles,” with investors largely playing for more of the same:
Range-bound yields
No recession impulse
No major central-bank repricing
Fading extremes of the hawkish move
Bullish / steepening UST trades
SOFR upside structures to monetize a relaxation of hike fears
That made sense while oil was bleeding lower and inflation prints were dovish. But when the market gets this compressed, the threshold for vol to reprice higher becomes lower. Crude does not need to create a full inflation shock immediately; it just needs to re-open the tail.
That is why Brent at early-June highs is so important. It threatens to take the market out of “macro malaise” and back into “hawkish knock-on” mode.
3. Equity Vol Has Been More Interesting Than Macro Vol
While rates and FX vol were asleep, equity vol became the more interesting opportunity set because of extreme dispersion.
The current US equity vol regime is unusual:
Single-name vol is extremely rich versus index vol.
Realized and implied dispersion ranks are around the 100th percentile.
Index vol has been “punchless” because correlation is extremely low.
SPX has absorbed single-name and thematic volatility better than NDX.
Vol-control / target-vol funds have bought roughly $50bn of US equities over the past two weeks because SPX realized vol is only around 9–10.
This is why SPX index vol has looked so dead despite violent moves underneath the surface. The index has been protected by rotation, low correlation, and offsetting flows.
The market structure has evolved from:
Mag 7 vs. the other 493
to semis over software
to AI winners vs. AI losers
to the current enablers / bottlenecks vs. hyperscalers capex trade.
This creates huge stock and basket-level dispersion while keeping index-level vol muted.
4. Why Correlation Has Stayed So Low
The low-correlation regime has both thematic and structural explanations.
Thematic bifurcation
Leadership keeps rotating across AI-linked buckets:
Semis
Software
AI enablers
Hyperscalers
Bottlenecks
Power / energy infrastructure
AI losers
Healthcare / defensive rotation beneficiaries
When one bucket sells off, another can catch flows. That keeps index vol contained.
Multi-manager market-neutral structure
Nomura’s structural point is important: multi-manager market-neutral platforms have become the incremental leveraged equity investor over the past 5–10 years, taking share from traditional long/short funds that run net exposure.
Because market-neutral platforms pair every long with a short, their de-risking tends to create reversal flows rather than pure “correlation 1” liquidation:
Longs are sold
Shorts are covered
Net market beta impact is muted
Factor reversals are violent
Index drawdowns are contained
That helps explain why we can see huge momentum unwind / semi drawdown without a full SPX event.
5. VVIX and VIX Call Skew Are Sending a Different Message
Even though front VIX is only around an 18 handle, SPX 20-day realized vol is around 9–10, and SPX / QQQ skew ranks are modest at roughly 23rd / 24th percentile, VVIX remains sticky near 100.
That stickiness does not quite fit a world where index vol looks so calm. It signals some underlying tension or “pucker.”
At the same time, VIX call skew is very steep, with 25-delta / ATM call skew ranking around the 96th percentile. This is notable because there is not currently an obvious VIX short-convexity issue:
Dealers do not appear meaningfully short VIX calls to clients.
Tail-hedging demand is low.
CFTC asset-manager VIX futures positioning is near the 1st percentile.
VIX ETNs have seen chunky redemptions.
Korean leveraged equity players have unwound after the sharp KOSPI drawdown.
So the steep VIX call skew is not simply “everyone is loaded with VIX upside.” The better explanation is that the crowded dispersion trade is buying VIX OTM calls as a hedge.
6. The Crowded Dispersion Trade Needs Corr-1 Protection
The key observation is that VIX OTM calls may be the preferred hedge for crowded dispersion books.
A dispersion trade is typically:
Long single-name vol
Short index vol
That works beautifully when single names move a lot but correlation stays low. But if correlation suddenly rises — a “Corr 1” event — the short index-vol leg becomes dangerous.
Given that single-name vol is extremely rich versus index vol and dispersion metrics are at extremes, the hedge is obvious: own convex index-vol upside, often via VIX calls.
That explains why:
Index skew looks modest,
VIX call skew is steep,
VVIX is sticky,
and the market is not obviously short VIX calls in the traditional way.
The stress point is not necessarily classic retail / ETN / dealer short-vol fragility. It is dispersion crowding and the risk that correlation rises sharply.
7. The Equity Sequencing: Rally First, Then Vol Risk
The near-term equity setup may still be bullish. Earnings have started positively: with roughly 14% of S&P reporting, around 94% are above consensus EPS and 77% are above consensus revenue. Over the next 2.5 weeks, about 70% of SPX market cap reports, including the largest names where the vol is concentrated.
The constructive point is that the earnings story is no longer just Mag 7 / mega-cap tech / hyperscalers. The capex trickle-down is now feeding into the other 493, and their contribution to overall S&P earnings growth has reportedly tripled since 4Q25. That is a real earnings-breadth impulse.
So the local trade may be equities up over the next week or two, particularly because investors just took books down meaningfully and may have to chase back into earnings prints. We are already seeing that:
DRAM up 12% in two days
High-beta momentum up 9%
AI enablers vs. hyperscalers long/short back 5.5%
This is the “force-in” rally risk: managers de-grossed into the drawdown, earnings are coming in fine, and short-dated calls are cheap enough to chase upside.
The desk’s preferred expression is cheap short-dated SPY calls, roughly 50bps of spot for about +1% OTM, to participate in the earnings tailwind.
8. But After the Force-In Rally, Things Can Get Squirrely
The more concerning setup comes after a potential earnings-driven rally.
If investors chase back in, positioning rebuilds. Once positioning is rebuilt, the market once again has something to de-risk. That is where August seasonality, low liquidity, low risk-taking tolerance, and vol positioning become more concerning.
The VIX futures positioning signal is notable. Asset-manager VIX futures positioning is extremely low / outright short. When Nomura widened the sample to the bottom 6th percentile, forward VIX futures returns became highly positive historically. In simple terms: when asset managers are this under-positioned for vol, forward VIX returns tend to go haywire.
That aligns with VIX seasonality and analog work pointing toward “vol higher” into the late-summer window. Seasonality and analogs are imperfect, but once widely socialized, they can become self-fulfilling — especially in August, when liquidity is thinner and risk facilitation is lower.
9. Trading Implications
Near term: local equities-up trade
The next one to two weeks may favor upside participation:
Earnings are beating.
Positioning was reduced materially.
Momentum has already snapped back.
AI / DRAM is rebounding.
Short-dated SPY upside is cheap.
Index vol remains subdued.
Earnings breadth is improving beyond Mag 7.
Preferred expression: short-dated SPY calls / call spreads, especially around the earnings tailwind.
Medium term: prepare for vol higher
After the chase / force-in rally, the risk shifts toward higher vol:
Crude can reignite the hawkish central-bank feedback loop.
Rates vol can transmit into all assets.
Dispersion is crowded.
Correlation is too low.
VVIX is sticky.
VIX call skew is steep.
Asset-manager VIX futures positioning is extremely low / short.
August seasonality and analogs point to vol higher.
Preferred hedges: VIX OTM calls, SPX / QQQ downside convexity, or structures that benefit from rising correlation / index vol.
Cross-asset watchpoints
The key triggers to monitor:
Brent crude — if it keeps rising, rates vol likely follows.
US 10-year yields / rates vol — the main transmission channel.
GOOGL / hyperscaler capex — determines whether AI re-underwrites higher.
Correlation / dispersion — the key equity vol fault line.
VIX call skew / VVIX — tension indicators.
SPX 7,480 pivot — tactical equity line.
VIX futures positioning — under-hedged vol setup.
August liquidity — where small shocks can become bigger moves.
Disclaimer: The material provided is for information purposes only and should not be considered as investment advice. The views, information, or opinions expressed in the text belong solely to the author, and not to the author’s employer, organization, committee or other group or individual or company.
Past performance is not indicative of future results.
High Risk Warning: CFDs are complex instruments and come with a high risk of losing money rapidly due to leverage. 68% and 74% of retail investor accounts lose money when trading CFDs with Tickmill UK Ltd and Tickmill Europe Ltd respectively. You should consider whether you understand how CFDs work and whether you can afford to take the high risk of losing your money.
Futures and Options: Trading futures and options on margin carries a high degree of risk and may result in losses exceeding your initial investment. These products are not suitable for all investors. Ensure you fully understand the risks and take appropriate care to manage your risk.
Patrick has been involved in the financial markets for well over a decade as a self-educated professional trader and money manager. Flitting between the roles of market commentator, analyst and mentor, Patrick has improved the technical skills and psychological stance of literally hundreds of traders – coaching them to become savvy market operators!