S&P500 Daily Action Areas & Price Targets 28/5/26

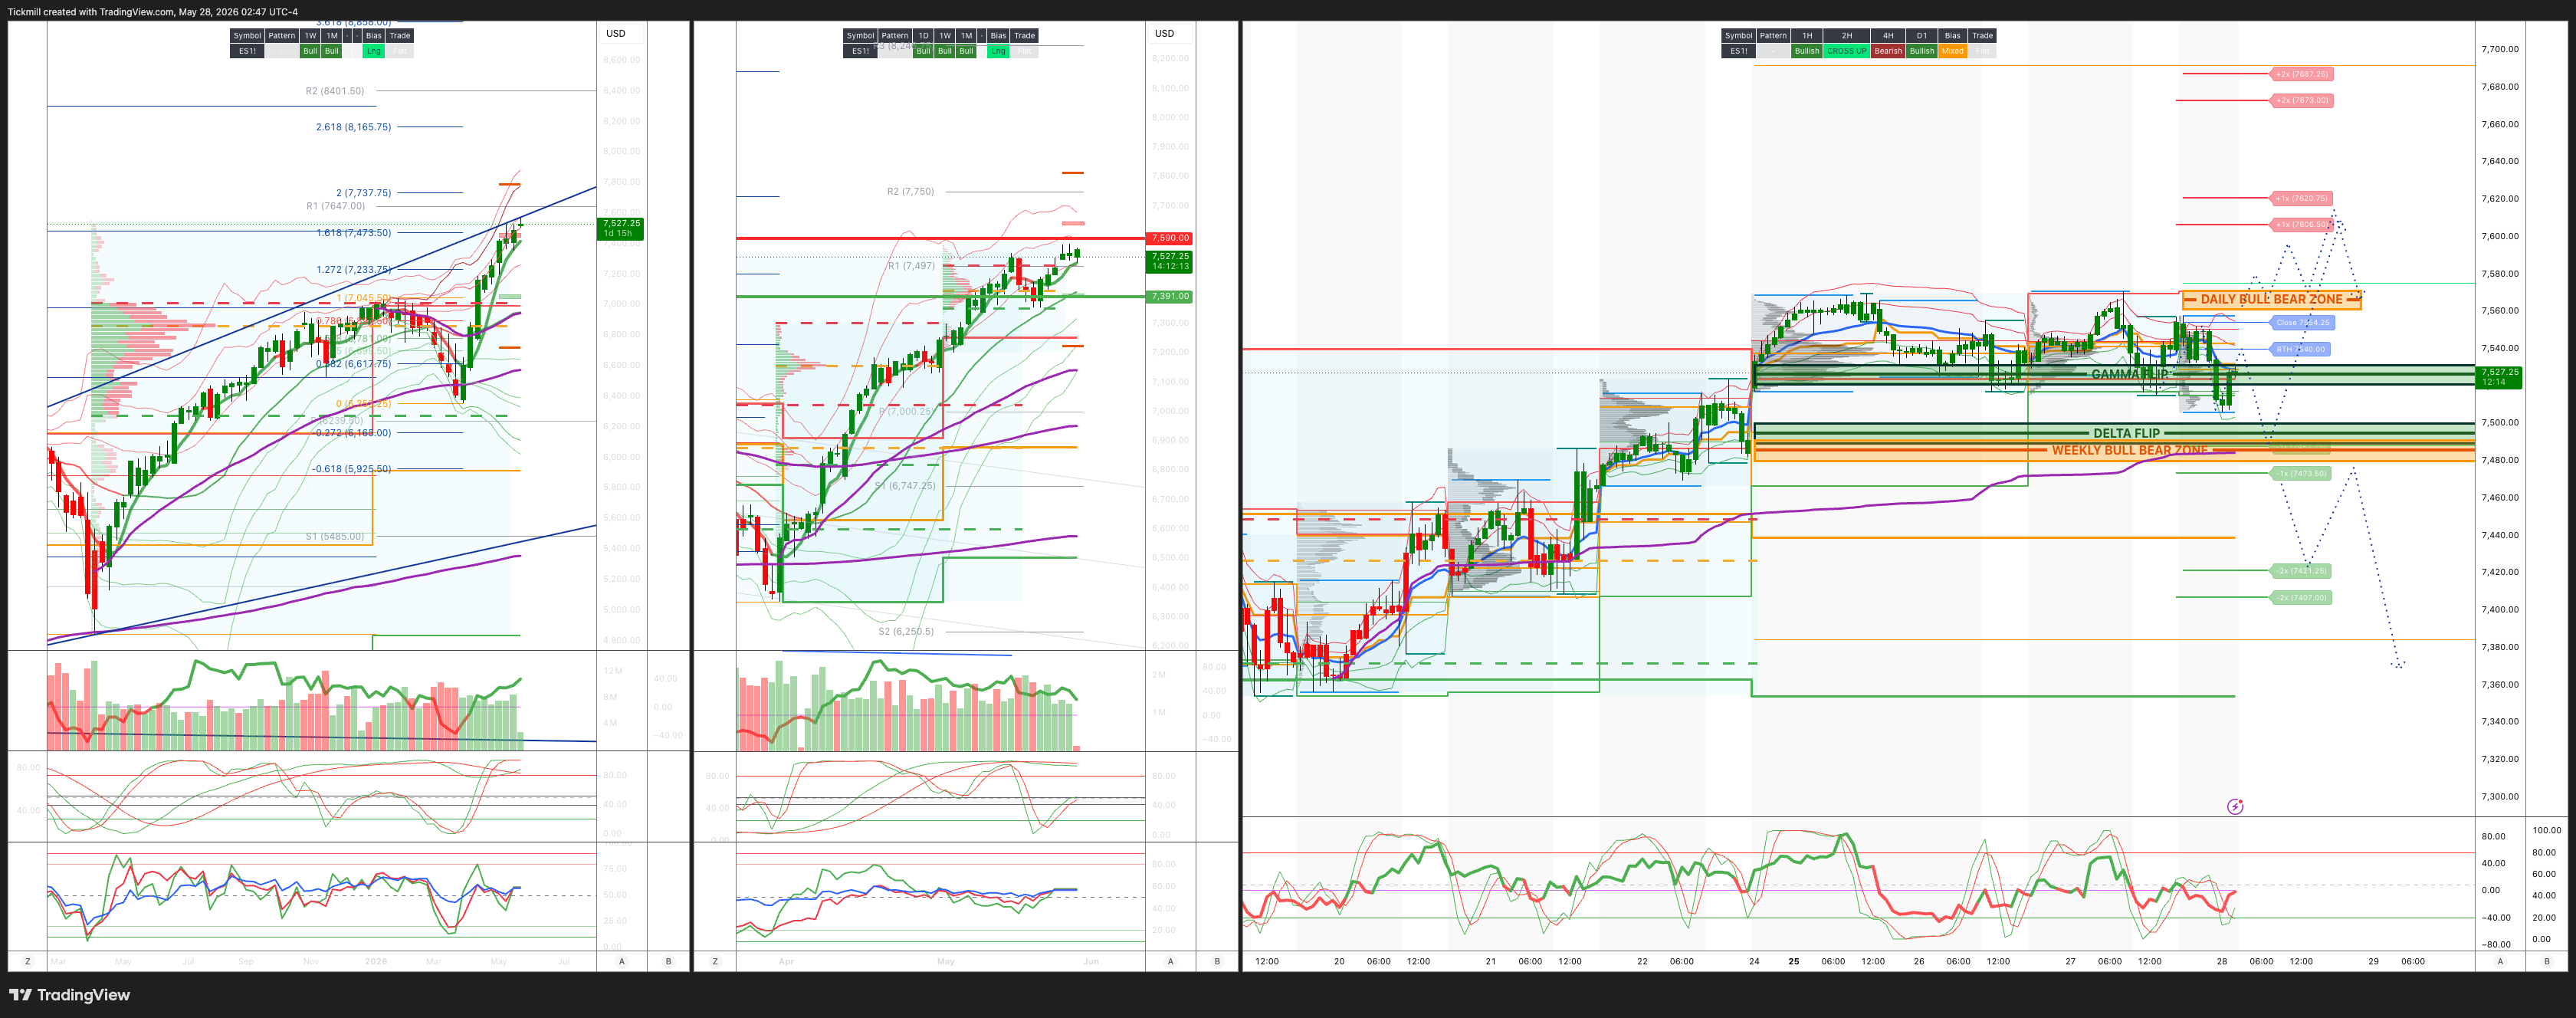
S&P500 Daily Action Areas & Price Targets 28/5/26
***QUOTING ES1! FOR CASH US500 EQUIVALENT LEVELS, SUBTRACT POINT DIFFERENCE***
WEEKLY BULL BEAR ZONE 7490/80
WEEKLY RANGE RES 7590 SUP 7391
June MOPEX Straddle: 274pt range implies a OPEX to OPEX range of [7134, 7683]
June QOPEX Straddle is 546.4pt giving us a range of [5960,7052]
JHEQX Q2 Collar 6189/6290 - 6865/6955
DEC2025 OPEX to DEC2026 OPEX is 945 points giving us a range of [5889,7779]
SPX PUT/CALL RATIO 1.18 (The numbers reflect options traded during the current session. A put-call ratio below 0.7 is generally considered bullish, and a put-call ratio above 1.0 is generally considered bearish)
DAILY VWAP BULLISH 7506
WEEKLY VWAP BULLISH 7417
MONTHLY VWAP BULLISH 6898
DAILY STRUCTURE – BALANCE 7555/7515
WEEKLY STRUCTURE – TBD
MONTHLY STRUCTURE - OTFH - 6514
Balance: This refers to a market condition where prices move within a defined range, reflecting uncertainty as participants await further market-generated information. Our approach to balance includes favouring fade trades at the range extremes (highs/lows) while preparing for potential breakout scenarios if the balance shifts.
One-Time Framing Higher (OTFH): This represents a market trend where each successive bar forms a higher low, signalling a strong and consistent upward movement.
One-Time Framing Lower (OTFL): This describes a market trend where each successive bar forms a lower high, indicating a pronounced and steady downward movement.
DAILY BULL BEAR ZONE 7560/70
GAMMA FLIP 7526
DELTA FLIP 7495
DAILY RANGE RES 7606 SUP 7488
2 SIGMA RES 7606 SUP 7407
VIX BULL BEAR ZONE 19
TRADES & TARGETS
LONG ON ACCEPTANCE ABOVE DAILY BULL BEAR ZONE TARGET WEEKLY/DAILY RANGE RES
LONG ON REJECT/RECLAIM WEEKLY BULL BEAR ZONE TARGET RTH/CLOSE > DAILY BULL BEAR ZONE > WEEKLY RANGE RES
SHORT ON REJECT/RECLAIM WEEKLY/DAILY RANGE RES TARGET DAILY BULL BEAR ZONE
LONG ON ACCEPTANCE ABOVE DAILY BULL BEAR ZONE TARGET WEEKLK RANGE RES
***ADDITIONAL SETUPS & TARGETS HIGHLIGHTED ON THE CHARTS***
(I FADE TESTS OF 2 SIGMA LEVELS ESPECIALLY INTO THE FINAL HOUR OF THE NY CASH SESSION AS 90% OF THE TIME WHEN TESTED THE MARKET WILL CLOSE ABOVE OR BELOW THESE LEVELS)
GOLDMAN SACHS TRADING DESK VIEW - ‘Broadening’
US equities were little changed at the index level, but the tape was much more active beneath the surface. The S&P 500 closed up 2bps at 7,520 despite a $4.3bn MOC imbalance to sell, while the Nasdaq 100 slipped 9bps to 29,974, the Russell 2000 was down 2bps at 2,920, and the Dow gained 36bps to 50,644. Volumes were again right in line with trend, with 18.84bn shares trading across US equity exchanges versus a YTD daily average of 19bn. Cross-asset, the standout move was crude, with WTI down another 466bps to $89.51 and now roughly $18 lower over five sessions. VIX fell 423bps to 16.29, the 10-year was unchanged at 4.48%, gold fell 118bps to 4,455, DXY was up 4bps to 99.21, and Bitcoin declined 112bps to $75,147.
The main story was the oil unwind and the rotation it is forcing beneath the index. The collapse in crude is driving a clean Consumer-over-Energy trade, with Consumer GICs up roughly 120-180bps while Energy fell around 140bps. That dynamic is starting to put upward pressure on laggards, especially areas that had been ignored during the semiconductor and memory chase. Software was the clearest example, with names like NOW, TEAM, HUBS, and WDAY up 3-6%. This looked less like a full abandonment of AI hardware and more like broadening: semis took a breather after a very sharp five-day move, while equal-weight pockets and select growth/internet names such as CPNG, SE, and MELI were well bid.
Floor activity was still modest, a 4 on a 1-to-10 scale, but the desk finished 281bps for sale versus a 30-day average of 135bps for sale. Asset managers were slight net sellers, with broad supply in Financials and Industrials. Hedge funds were roughly $2bn net sellers, mostly driven by trims in Tech. That is notable given the recent aggressive rebuild in tech and semi exposure. It does not yet look like a major de-risking event, but it does suggest some profit-taking and rebalancing after the Momentum surge earlier in the week.
Post-close earnings reinforced the bifurcation in software. CRM traded down around 3% after largely inline results that were broadly down the fairway, though with enough KPIs and moving parts to keep investors cautious. SNOW, by contrast, surged 27% after a major topline re-acceleration, with management explicitly pointing to AI as a powerful tailwind and calling Q1 a clear inflection point in that journey. MDB also rallied around 8% after hours in sympathy. That matters for the broader market because software has been under-owned and under-loved relative to semis; a strong SNOW print gives investors a clean reason to revisit the AI monetization and data-infrastructure side of the trade.
In derivatives, the market continued to digest conflicting geopolitical headlines, but the S&P remained tightly range-bound intraday, trading in just a 40bp band. Skew was bid after yesterday’s notable crush, but the larger point is that normalized S&P skew has flattened dramatically over the past several sessions. Downside puts are now the cheapest they have been relative to calls in more than a year and a half. Against that backdrop, the desk thinks S&P 3-month 25-delta puts look attractive and also likes June VIX 25/35 call spreads. The gamma setup remains supportive for spot here: after the rally, the market is cushioned on small moves lower, with peak long gamma around 1% below spot and a roughly 2% drawdown needed to produce a more meaningful shift in dealer positioning.
The event risk is now PCE, and the options market is pricing a relatively contained but relevant move into the print. The S&P straddle to Thursday’s close is implying roughly a 48bp move, which equates to about 36 points on the S&P from the 7,520 close. In practical terms, that puts the implied Thursday close range around 7,484 to 7,556. That is a fairly tight event-market range, especially given the amount of rotation under the surface and the importance of inflation for the recent lower-oil, stable-yields, growth-broadening setup. If PCE lands benignly and the index stays within or above the implied range, the market can likely continue rotating into Consumer, Software, equal-weight growth, and other laggards. If the print forces a move outside the straddle, especially lower through the implied range, attention should shift quickly back to rates sensitivity, crowded Tech exposure, and the sustainability of the recent Momentum unwind.
Flows in options included a large QQQ hedge roll, with $118m of premium spent on 100k December 660/590 put spreads. That is consistent with the broader theme of investors staying long growth exposure while using downside structures to protect gains. The interesting tension is that investors are still willing to pay for targeted hedges in growth-heavy products even as broad S&P downside puts have become unusually cheap versus calls. With the PCE straddle only pricing 48bps, realized volatility around the print will matter. A small move keeps the long-gamma, range-bound regime intact; a larger move could challenge the calm implied by the straddle and force faster repositioning.
Overall, the index tape was quiet, but the underlying message was important. The market is beginning to broaden away from the most crowded semiconductor and memory winners into Consumer, Software, and select internet/growth laggards, helped by the sharp collapse in oil. Energy is becoming a funding source, while lower crude is improving the relative setup for consumer-facing and duration-sensitive names. The risk/reward in broad index upside is less obvious after the recent rally, but the rotation beneath the surface remains active. With downside puts unusually cheap versus calls and the PCE straddle pricing only a 48bp move, this is a good point to stay invested in the broadening trade while adding selective protection in case inflation breaks the range..
Disclaimer: The material provided is for information purposes only and should not be considered as investment advice. The views, information, or opinions expressed in the text belong solely to the author, and not to the author’s employer, organization, committee or other group or individual or company.
Past performance is not indicative of future results.
High Risk Warning: CFDs are complex instruments and come with a high risk of losing money rapidly due to leverage. 68% and 74% of retail investor accounts lose money when trading CFDs with Tickmill UK Ltd and Tickmill Europe Ltd respectively. You should consider whether you understand how CFDs work and whether you can afford to take the high risk of losing your money.
Futures and Options: Trading futures and options on margin carries a high degree of risk and may result in losses exceeding your initial investment. These products are not suitable for all investors. Ensure you fully understand the risks and take appropriate care to manage your risk.
Patrick has been involved in the financial markets for well over a decade as a self-educated professional trader and money manager. Flitting between the roles of market commentator, analyst and mentor, Patrick has improved the technical skills and psychological stance of literally hundreds of traders – coaching them to become savvy market operators!