- Futures
-
Tickmill Experts
REAL TIME NEWS
Loading...
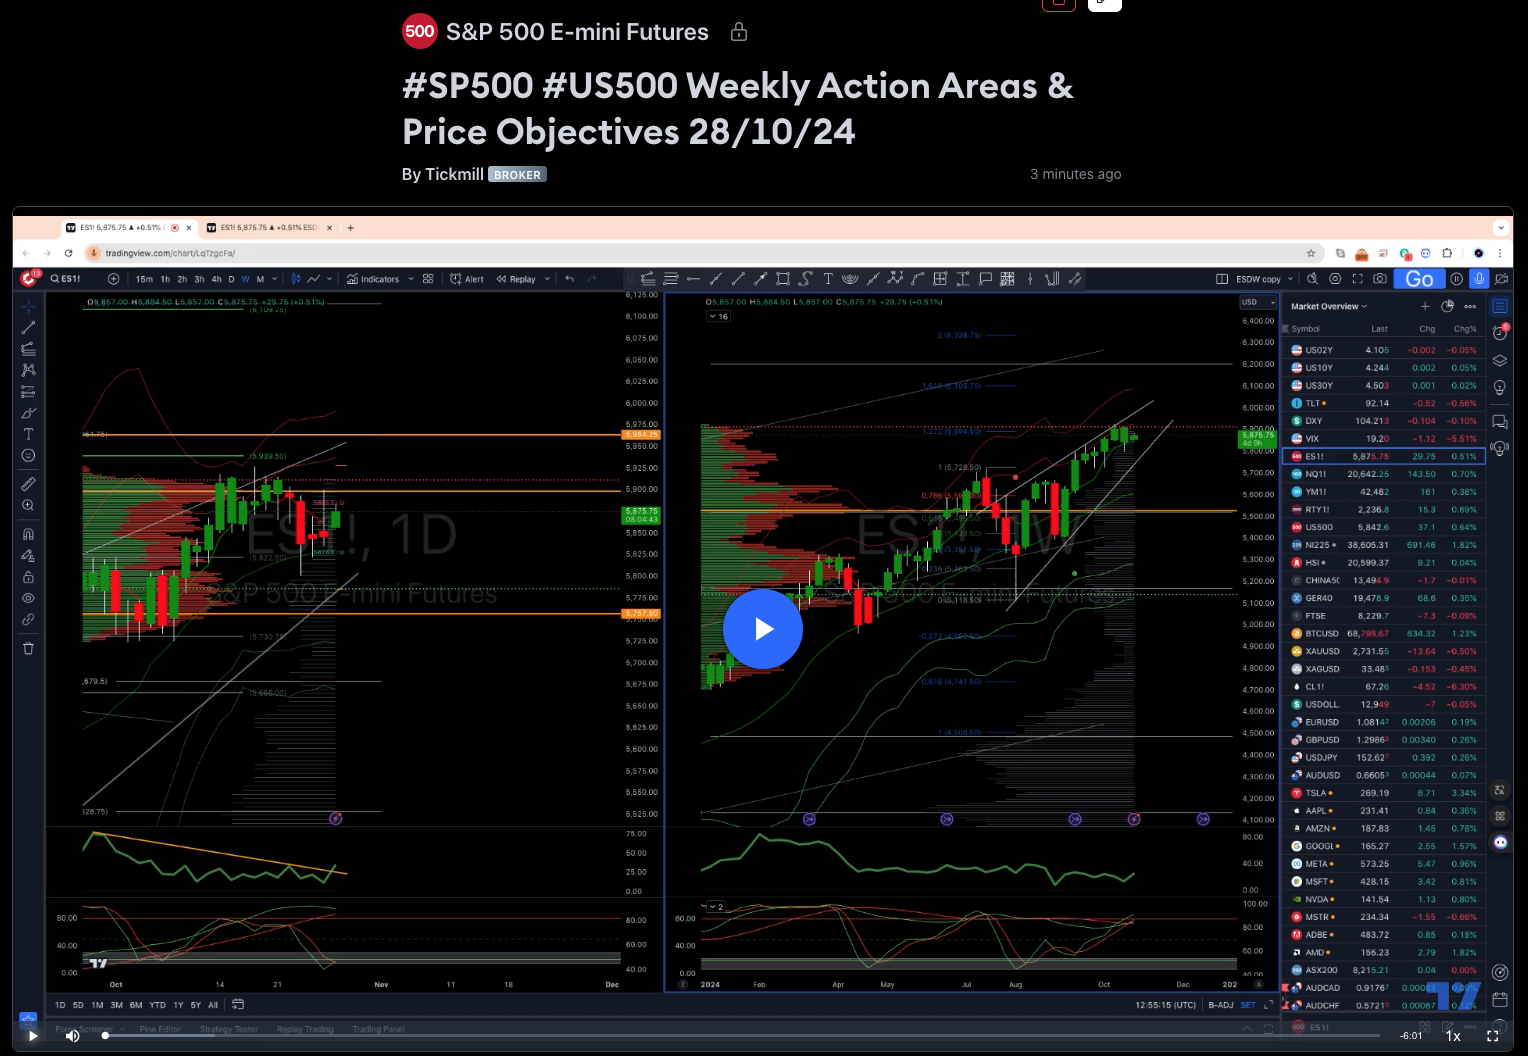
E-mini SP500 Weekly Live Market & Trade Analysis 13/7/26Real-time actionable analysis on futures markets, with a specific focus on E-mini S&P500 action areas & price objectives for the trading week ahead—to review this week's analysis, click here!...
E-mini SP500 Weekly Live Market & Trade Analysis 13/7/26Real-time actionable analysis on futures markets, with a specific focus on E-mini S&P5
Title: XAGUSD H1 | Bullish bounce off Type: Bullish bounce Preference: The price has bounced off the pivot at 59.59, a pullback support. A rise from this level could lead the price toward the 1st resistance at 60.66, an overlap resistance. Alternative Scenario: If ...
Title: XAGUSD H1 | Bullish bounce off Type: Bullish bounce Preference: The price has bounced off the pivot at 59.59, a pullback support. A rise from t
Fresh US/Iran AttacksCrude oil prices have gapped higher at the start of the week as rising tensions in the Middle East fuel uncertainty once again. The US has resumed aerial attacks on Iran as the standoff between the two continues this week. The US began a new wa...
Fresh US/Iran AttacksCrude oil prices have gapped higher at the start of the week as rising tensions in the Middle East fuel uncertainty once again. T
Title: NZDUSD H4 | Potential bearish reversal Type: Bearish reversal Preference: The price has rejected off the pivot at 0.5774, which is a pullback resistance that aligns witht the 61.8% Fibonacci retracement. A drop from this level could lead the price toward th...
Title: NZDUSD H4 | Potential bearish reversal Type: Bearish reversal Preference: The price has rejected off the pivot at 0.5774, which is a pullback
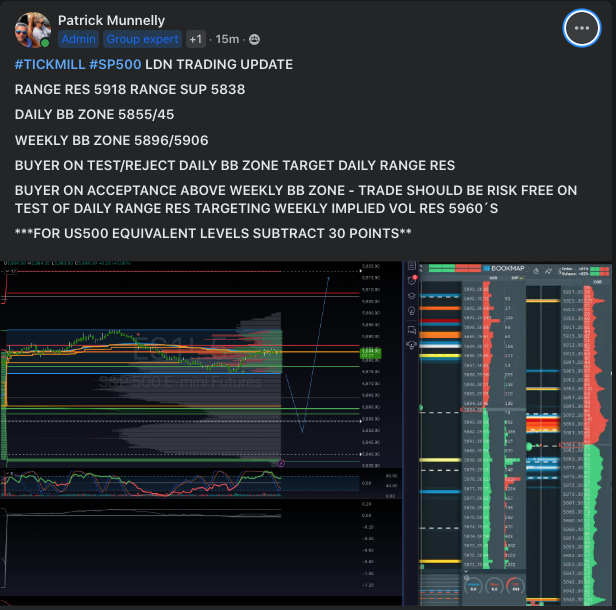
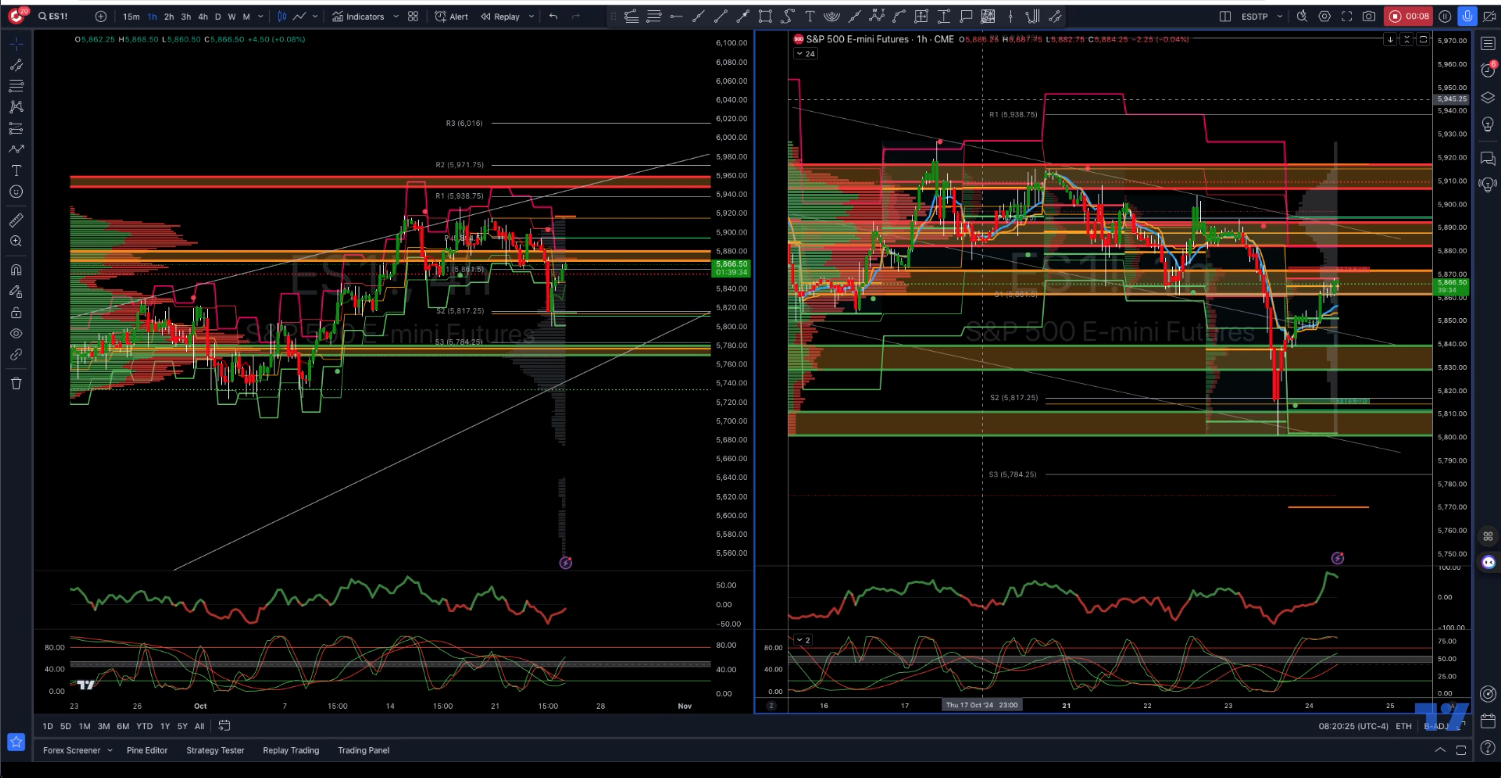
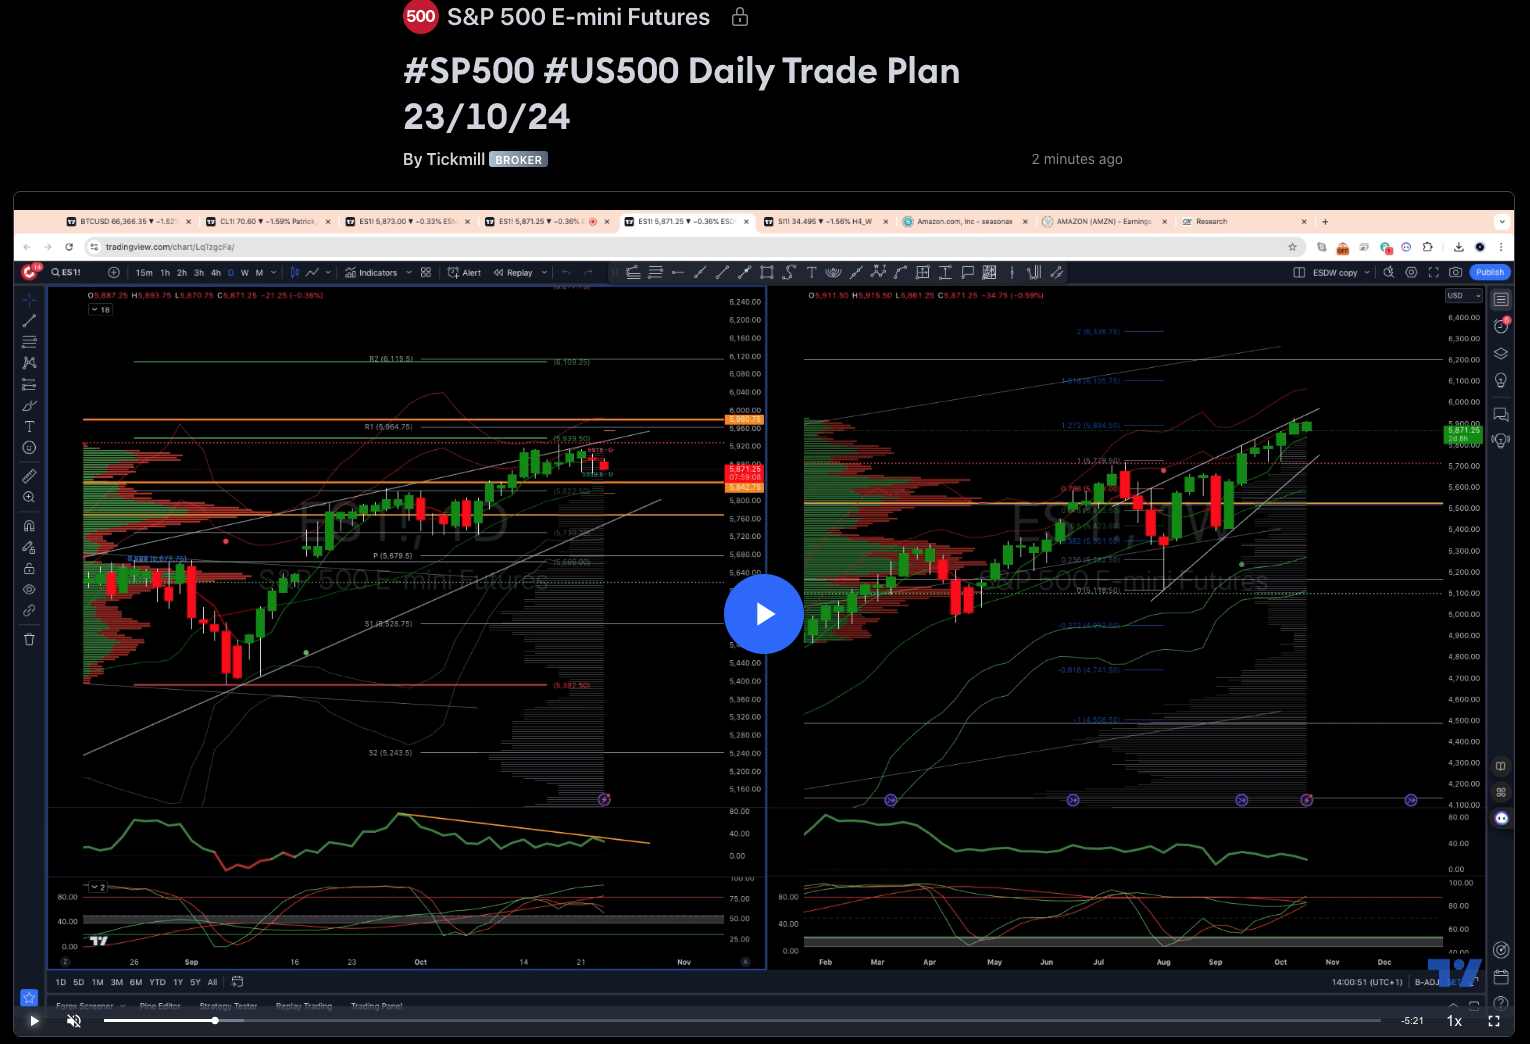
S&P500 Daily Action Areas & Price Targets 13/7/26***QUOTING ES1! FOR CASH US500 EQUIVALENT LEVELS, SUBTRACT POINT DIFFERENCE***WEEKLY BULL BEAR ZONE 7460/40WEEKLY RANGE RES 7710 SUP 7530MONTHLY RANGE RES 7932 SUP 7384JHEQX Q3 Collar Short Call Cap: ~7,750 –...
S&P500 Daily Action Areas & Price Targets 13/7/26***QUOTING ES1! FOR CASH US500 EQUIVALENT LEVELS, SUBTRACT POINT DIFFERENCE***WEEKLY BULL BEA
Title: NZDJPY H4 | Bullish bounce off strong support Type: Bullish bounce Preference: The price is falling toward the pivot at 92.70, an overlap support that aligns with the 38.2% Fibonacci retracement. A bounce from this level could lead the price toward the 1st r...
Title: NZDJPY H4 | Bullish bounce off strong support Type: Bullish bounce Preference: The price is falling toward the pivot at 92.70, an overlap suppo
Title: GBPUSD H4 | Falling towards strong supportType: Bullish bouncePreference: The price is falling toward the pivot at 1.3334, an overlap support. A bounce at this level could lead the price toward the 1st resistance at 1.3431, a pullback resistance.Alternative ...
Title: GBPUSD H4 | Falling towards strong supportType: Bullish bouncePreference: The price is falling toward the pivot at 1.3334, an overlap support.
Daily Market Outlook, July 13, 2026Patrick Munnelly, Partner: Market Strategy, Tickmill GroupMunnelly’s Macro Minute — Strikes Shift Sentiment, Crude Cranks HigherOil is back on the boil, bonds are back under pressure, and the AI rally has run straight into another...
Daily Market Outlook, July 13, 2026Patrick Munnelly, Partner: Market Strategy, Tickmill GroupMunnelly’s Macro Minute — Strikes Shift Sentiment, Crude
Fresh US/Iran AttacksThe US Dollar is starting the week in a muted fashion with the DXY a little softer through the European open on Monday. Traders are monitoring headlines on the Middle East following the fresh attacks overnight between the US and Iran. The US ca...
Fresh US/Iran AttacksThe US Dollar is starting the week in a muted fashion with the DXY a little softer through the European open on Monday. Traders a
JPM G10 FX DailyEUR: Relief From Panic, But Still an Uneasy Steady StateThere has been some relief from Wednesday’s panic extremes.As expected, the Middle East situation remains fluid with no certainty around any endgame.Noise has clearly ratcheted up this week.But...
JPM G10 FX DailyEUR: Relief From Panic, But Still an Uneasy Steady StateThere has been some relief from Wednesday’s panic extremes.As expected, the Mi
-1730196329.jpeg)
-1730113729.jpeg)
-1729584805.jpeg)