Institutional Insights: Goldman Sachs SP500 Flows & Positioning 14/7/26

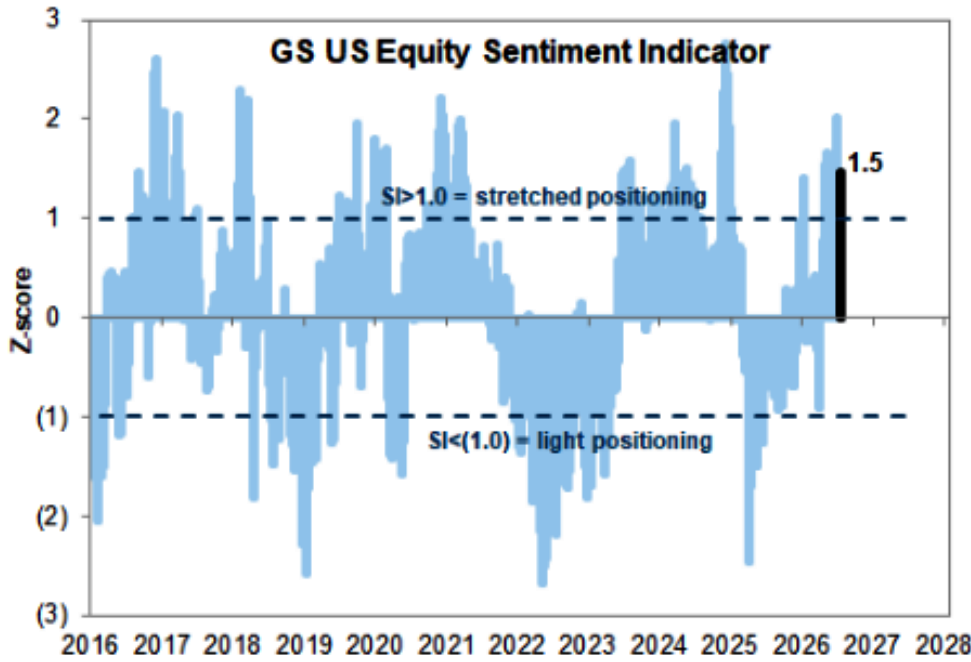
GS Positioning Recap — Cleaner, but Not Yet Durable Risk-On
The consolidated positioning picture suggests the market has de-risked enough to create cleaner upside optionality, but the quality of demand remains mixed. CTAs are modest buyers in the baseline scenario, hedge funds have returned to net buying after four weeks of selling, and Info Tech was the most net-bought sector globally. However, much of the buying is still being driven by short covering rather than aggressive long accumulation, while buyback demand remains seasonally constrained with roughly 97% of the S&P 500 in blackout.
The key message is that positioning is no longer as stretched or one-sided as it was into the late-June AI/momentum peak, but it is also not yet a clean “all clear.” The market has less crowding risk than it did a few weeks ago, but it is still vulnerable to downside convexity if spot breaks key CTA thresholds, especially with liquidity thin, earnings beginning, and macro/geopolitical risk elevated.
1. CTA Corner — Baseline Buying, but Downside Convexity Is Material
The systematic trend-following cohort has net purchased roughly $2bn of global equities over the past week and $2.5bn over the past month. As of Friday’s close, CTA flow forecasts point to $13.5bn of global equity buying over the next week in the baseline scenario, including roughly $6.0bn into the US.
The one-week forecast is relatively supportive:
Scenario | Global Equity Flow | US Equity Flow |
|---|---|---|
Flat tape | +$13.52bn | +$5.98bn |
Up tape | +$13.14bn | +$5.36bn |
Down tape | -$3.11bn | +$4.11bn |
The important nuance is that US flows remain positive even in the one-week down-tape scenario, with CTAs still expected to buy around $4.1bn of US equities. That should provide some near-term cushion for US indices, particularly if the S&P stays above the short-term pivot level.
However, the one-month forecast is much more asymmetric:
Scenario | Global Equity Flow | US Equity Flow |
|---|---|---|
Flat tape | +$14.67bn | +$6.65bn |
Up tape | +$41.66bn | +$9.79bn |
Down tape | -$127.68bn | -$42.55bn |
This is the real risk. If the market remains flat or rallies, CTAs can provide incremental demand. But in a sustained downside tape, the model projects $127.7bn of global equity selling, including $42.6bn out of US equities over the next month. That makes spot levels especially important.
CTA Pivot Levels for SPX
The key SPX CTA pivot levels are:
Horizon | SPX Pivot |
|---|---|
Short term | 7,427 |
Medium term | 7,154 |
Long term | 6,726 |
With the S&P last closing at 7,515, the market is only about 88 points above the short-term CTA pivot at 7,427, or roughly 1.2% above that level.
That matters because yesterday’s end-of-week implied range was approximately 7,425 to 7,605, which effectively overlaps the 7,427 short-term CTA pivot. In other words, the options market is pricing a normal catalyst-week move that could take the S&P directly to the level where systematic support may begin to deteriorate. A clean break below 7,427 would raise the risk that CTA flow forecasts shift from modest support to more meaningful supply.
The medium-term pivot at 7,154 is still much further away, roughly 4.8% below the current close, while the long-term pivot at 6,726 is roughly 10.5% lower. So this is not yet a full systematic deleveraging setup, but the first CTA tripwire is very much in play during the CPI / bank earnings / geopolitical oil-risk window.
2. GS Prime Brokerage — Net Bought, but Mostly Short Covering
GS PB data show global equities were net bought for the first time in a month, at +0.8 standard deviations versus the one-year average. That sounds constructive at the headline level, but the flow composition matters: gross trading activity fell for the first time in a month, and the buying was driven by both short covers and long buys, with short covers outpacing long buys by 2.8 to 1.
So the market did see demand, but it was not classic risk-on demand. It was partly a de-grossing / short-covering event, consistent with the recent unwind in crowded factors and painful short-side moves.
Overall hedge fund book metrics:
Metric | Latest | Change | Percentile |
|---|---|---|---|
Gross leverage | 309.9% | -3.5 pts | 72nd percentile, 1Y |
Net leverage | 80.1% | +1.0 pts | 65th percentile, 1Y |
L/S ratio | 1.697 | +1.3% | 33rd percentile, 1Y |
The decline in gross leverage confirms continued de-risking, while the increase in net leverage shows that net exposure rose modestly as shorts were covered faster than longs were sold. That explains the apparently mixed signal: funds are less grossed up, but slightly more net long. It is supportive for index levels in the short run, but it does not necessarily indicate strong conviction.
The L/S ratio at the 33rd percentile over one year suggests hedge fund books are not aggressively long relative to recent history. That leaves room for re-risking if earnings and macro cooperate, but also reflects caution after the AI/momentum drawdown.
Info Tech — Most Net Bought After Four Weeks of Selling
After four consecutive weeks of net selling, Info Tech was the most net-bought US and global sector, at +1.8 standard deviations versus the one-year average. This was driven by short covering and, to a lesser extent, long buying.
That is important because tech has been the epicenter of the recent factor unwind. A return of buying into Info Tech suggests positioning is cleaner and some investors are beginning to add back exposure. But again, the buying quality matters. If the majority is short covering, the move can help stabilize the sector tactically, but it does not yet prove that large fundamental investors are rebuilding long exposure aggressively.
This fits the broader AI setup: after a significant washout in momentum, investors are more willing to add selectively to data centers, semis, and hyperscalers, but they are not indiscriminately chasing the first-half winners.
3. Buybacks — Blackout Now, August Support Later
Buyback flows remain seasonally muted because the market is deep in earnings blackout. GS estimates roughly 97% of the S&P 500 is currently in blackout ahead of quarterly earnings. That removes a major source of corporate demand during a period when liquidity is already thin and macro catalysts are elevated.
Current desk execution is heavily skewed toward 10b5-1 plans, which account for around 80% of total order count. That is typical during blackout periods, but it means discretionary repurchase demand is limited.
The positive offset is that buybacks should pick up meaningfully in August as companies exit blackout windows. In a quiet summer market, that could become a key source of demand, particularly if earnings are good enough and corporates resume repurchases into lower realized volatility. For now, however, the market does not have its usual corporate bid at full strength.
Synthesis — What the Positioning Setup Means Now
The positioning backdrop is better than it was in late June, but it is not a clean green light. There are three important takeaways:
1. Positioning Has Cleaned Up
Momentum and AI exposure have been reduced, hedge fund gross leverage has fallen, and Info Tech has finally seen net buying after four weeks of selling. This lowers the risk of another immediate crowded-long air pocket, especially if CPI and bank earnings are benign.
2. Demand Quality Is Still Mixed
Hedge fund buying is being driven more by short covering than long accumulation. CTA baseline flows are supportive, but global trend signals outside the US are in neutral territory and could fade quickly. Buybacks are constrained by blackout. So the market has some support, but not yet the kind of durable, multi-channel demand that would make downside risk irrelevant.
3. The SPX 7,427 Level Is Critical
The short-term CTA pivot at 7,427 is the key level to watch. It sits almost exactly at the lower end of the current end-of-week implied range. A hold above that level would preserve the constructive baseline CTA demand and support the view that this remains a choppy rotation near highs. A break below 7,427 would increase the risk of systematic selling and could shift the tape from “thin summer volatility” to a more mechanical de-risking episode.
Trading Implication
Near term, the positioning setup argues for a balanced stance:
Stay constructive if SPX holds above 7,427.
Use dips selectively to add to cleaned-up AI/data-center/hyperscaler exposure.
Avoid chasing crowded upside given low vol, low panic, and expensive single-stock calls.
Own cheap index hedges into CPI and earnings.
Watch for a break of 7,427 as the point where downside flow risk becomes more relevant.
Look to August for a potential buyback-supported demand tailwind once blackout windows reopen.
Positioning is no longer stretched, but the market is not yet fully re-risked. The cleaner setup creates room for upside if catalysts cooperate, but the CTA pivot at 7,427 is the line in the sand. Above it, the market can absorb noise. Below it, the downside flow profile deteriorates quickly.
Disclaimer: The material provided is for information purposes only and should not be considered as investment advice. The views, information, or opinions expressed in the text belong solely to the author, and not to the author’s employer, organization, committee or other group or individual or company.
Past performance is not indicative of future results.
High Risk Warning: CFDs are complex instruments and come with a high risk of losing money rapidly due to leverage. 68% and 74% of retail investor accounts lose money when trading CFDs with Tickmill UK Ltd and Tickmill Europe Ltd respectively. You should consider whether you understand how CFDs work and whether you can afford to take the high risk of losing your money.
Futures and Options: Trading futures and options on margin carries a high degree of risk and may result in losses exceeding your initial investment. These products are not suitable for all investors. Ensure you fully understand the risks and take appropriate care to manage your risk.
Patrick has been involved in the financial markets for well over a decade as a self-educated professional trader and money manager. Flitting between the roles of market commentator, analyst and mentor, Patrick has improved the technical skills and psychological stance of literally hundreds of traders – coaching them to become savvy market operators!