Institutional Insights: JPMorgan Trading CPI 13/1/25

CPI forecast (Feroli / JPM Economics)
The baseline call is for a firm CPI print, driven by technical “catch-up” effects after a period of disrupted data collection.
Headline CPI (MoM): +0.38%
Core CPI (MoM): +0.41%
Implied YoY: 2.7% headline, 2.8% core
Why they expect a “pop” in this print
Government shutdown distortions: BLS reportedly held prior-month prices constant (effectively “flat-lined” some components), which can mechanically boost the next update when prices “reset.”
Holiday sales oversampling: Data collection resumed later, potentially over capturing sale prices in the prior month (especially for goods), which would have artificially depressed goods inflation—setting up a bounce-back.
Scenario map: Core MoM vs. 1‑day SPX move (Trading desk view)
They focus on core MoM buckets and assign probabilities + typical 1‑day SPX reaction ranges.
5.0% prob: Core MoM > 0.45% → SPX −1.25% to −2.5%
32.5% prob: Core MoM 0.40%–0.45% → SPX +0.25% to −0.75%
40.0% prob: Core MoM 0.35%–0.40% → SPX +0.25% to +0.75%
20.0% prob: Core MoM 0.30%–0.35% → SPX +1.0% to +1.5%
2.5% prob: Core MoM < 0.30% → SPX +1.25% to +1.75%
Options market “expected move”
Options expiring Tuesday price about a ~0.6% move (as of Fri Jan 9 close).
Desk takeaway (positioning + asymmetry)
Their framing is: fundamentals lean hawkish, but equity tape outcomes are skewed bullish.
Setup: markets are “bulled up,” and they see hawkish print risk > dovish print risk.
But SPX reaction distribution isn’t symmetric (they explicitly argue the market’s upside/downside behavior isn’t balanced).
Since Oct 1, 2025: 5× +1% up days vs 7× −1% down days (used as context for skew/behavior).What components they highlight (mechanics under the hood)
This section is basically “why the seasonal/collection quirks matter.”
Vehicles
New vehicles: tracked industry data suggests ~+0.6% in December.
Used vehicles: wholesale declines imply ~−1.0% SA.
Broad goods & services impacted by bimonthly sampling
Many prices may not have been properly refreshed since August due to bimonthly collection schedules + shutdown disruption → potential upward catch-up (they cite medical care as an example).
Shelter (OER & rent) has its own lag/rotation issue
Because shelter is collected on a rotating 6‑month panel, treating October as “unchanged” likely biased down measured OER/rent.
They expect December shelter prints to better reflect underlying trend, potentially ~2× November’s shelter pace.
The “bias down” from the skipped update may persist until the relevant panel refreshes (they mention next April).
Business surveys (ISM/PMIs) suggest:
Input prices still rising
Earlier reluctance to raise selling prices (protect market share), but with recent GDP strength, more firms may be passing costs through.
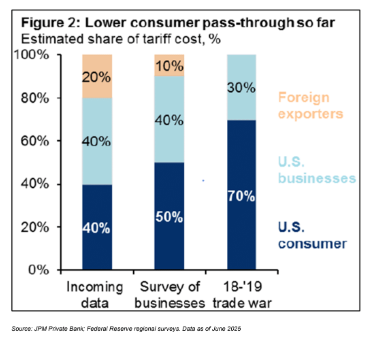
Tariff pass-through context (JPM PB estimate): ~45% vs ~70% in “Trump 1.0”.
Macro risk: another inflation peak is seen as a higher-probability equity risk in 1H26.
Policy implication: CPI + Friday’s NFP could push Fed cuts further out; Feroli’s view: Fed takes no action in FY26.
Disclaimer: The material provided is for information purposes only and should not be considered as investment advice. The views, information, or opinions expressed in the text belong solely to the author, and not to the author’s employer, organization, committee or other group or individual or company.
Past performance is not indicative of future results.
High Risk Warning: CFDs are complex instruments and come with a high risk of losing money rapidly due to leverage. 69% and 73% of retail investor accounts lose money when trading CFDs with Tickmill UK Ltd and Tickmill Europe Ltd respectively. You should consider whether you understand how CFDs work and whether you can afford to take the high risk of losing your money.
Futures and Options: Trading futures and options on margin carries a high degree of risk and may result in losses exceeding your initial investment. These products are not suitable for all investors. Ensure you fully understand the risks and take appropriate care to manage your risk.
Patrick has been involved in the financial markets for well over a decade as a self-educated professional trader and money manager. Flitting between the roles of market commentator, analyst and mentor, Patrick has improved the technical skills and psychological stance of literally hundreds of traders – coaching them to become savvy market operators!